
Here’s a nifty technical trick I picked up over the past couple of years, especially helpful for day trading or quick scalps. Although I now primarily use it as a swing trader to time my entry/exit points more effectively, it can still be used for short-term trades or multi-day swing plays.
So what is the $TICK? In simple terms, it compares the number of rising stocks versus falling stocks within the NYSE. Investopedia offers a great definition (shoutout to Investopedia, I love you – a fantastic free resource for definitions and 101’s), so be sure to check out the basics there. Already, you can see how this trick would come in handy. After more than two years of testing and closely observing it, the $TICK trick helped me with timing my trades, something I had struggled with for quite some time.
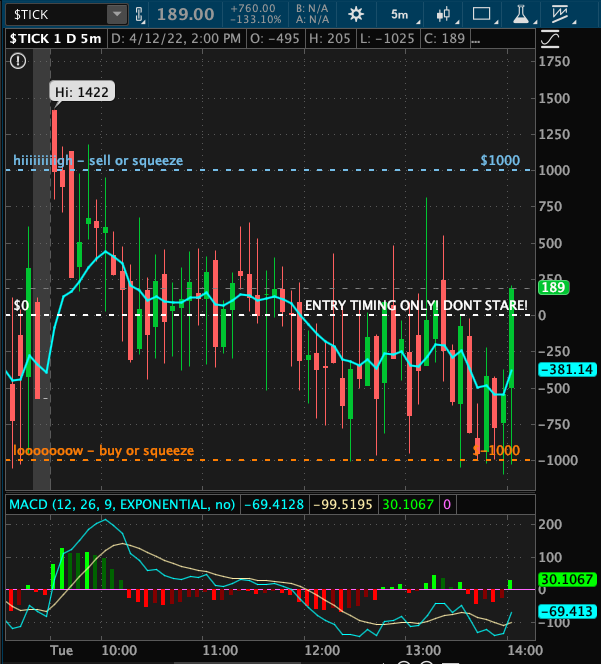
What caught my attention when I first started using this tactic was how the $TICK indicator can indicate that 3/4 of the stocks in my watchlist fall when it’s down below the 0 mark, almost without fail. Check out Investopedia for a more in-depth explanation. I’ve included an image of my technical indicator setup for $TICK. When the numbers are above 0 (white line), the market tends to be moving up; when it’s below 0, it’s going down. When it’s up convincingly, I sell my long positions or enter short. If it’s down, I buy into long positions or sell/cover my short positions.
To make it even more fun, add the MACD or the TTM_Squeeze indicator to the mix. I’ve used both but settled on MACD in this case. The momentum indicator gives you an even more precise read on the markets and helps with timing extreme selloffs or upward surges. For me, the key was to pay more attention to the slower band within MACD (slower white band). I also added an 8 EMA to get a better visual of the direction. And, this is all on a 5-minute chart for a 2-day period.
The basic outline is to watch the extremes with the $TICK for optimal entries or exits. It’s also a really nice heads up for possible market squeezes too. When the $TICK stays above or below the 1000 mark for extended periods of time (not super common), that is a bonafide squeeze. The probability that the market will sustain its move in that direction (bullish or bearish) is likely. I look at the 4-hour charts with other market charts (SPY, QQQ, etc.) in these extremes; that time frame comes in handy and helps clarify too.
For example, if the $TICK is at 1200+ and sustaining the move, there could be a huge short squeeze going on in the overall market at that time. The bears got caught off guard and/or some wild euphoric inducing catalyst is happening. Conversely, if it’s down below into the -1200 area for quite a while and struggling to even get back to zero, then you have yourself an extreme sell-off day (or period/cycle). I wouldn’t usually be looking for a dip buy in the latter situation, and in the former, I certainly wouldn’t be looking to short the top either.
Note that on my $TICK screen, I have permanently printed on it: “Don’t Stare!”. I caught myself many times, focused on the $TICK, and not watching anything else. I think I spent way too much time dabbling with this tactic. This was a month(s)-long problem that I found out about myself; it was addicting!
In my experience, the momentum indicator synced up with the $TICK being way above or below the 0 mark provides confirmation of proper timing. For example, if you are long biased and the $TICK is below 0 and the MACD divergence is just starting to cross back up after being in a down cycle, that is your entry signal.
Once you receive the buy signal from the overall market, it’s time to look at the individual stock that’s in play. Let’s say we are going long in this scenario. Our $TICK signal has been triggered, so it’s a matter of waiting for a bit of a sell-off with your selected long-biased stocks. Look for a nice little dip close to where you know your stop loss would be. The optimal entry is presented when you follow this guideline faithfully. It’s all about being patient and letting the $TICK, overall market conditions, and your stock coincide with the entry timing.
I rarely follow $TICK quite as closely or religiously with exits as I do with entries. I usually use it as a rough outline. With a well-timed (low risk high reward) entry, I find with swing trading it’s a matter of “setting and forgetting” and letting it play out. With day trading, I found this tactic more helpful for exits. I might watch the $TICK for obvious signs that my position is (more than likely) at the high or low of the day. For exits, I just use it as a barometer for the extremes if I know I’m getting out soon.
Overlay the SPY, QQQ, IWM, etc. against what the $TICK is showing. This could be a helpful tip just to help you get in the flow of the traffic. Overall, I found this helped me get a read on entry timing, especially in the AM trading hours. For me, the $TICK trick fit nicely with the other relative indicators/charts I have set in place. I hope it fits somewhere in your trading system too.