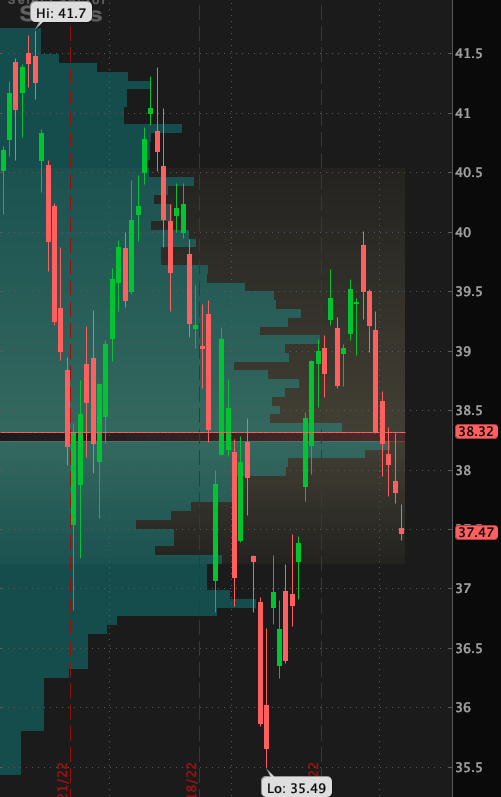
As a beginner, I was like most traders chasing the magical numbers of indicators. I spent a lot of time trying to master the MACD and incorporate Bollinger Bands in my trading strategy. But the truth is, most experienced traders that I’ve seen trading for over five years have very few indicators.
With this volume/order levels technique, I have ditched most of my indicators. At first, it was hard since I had been trading with EMA’s from day one. However, after months of ignoring them, I realized it was time to move on. The adage “Keep it simple stupid” is true. It’s all about the levels.
I knew from day one that volume was king, but I didn’t understand the significance of support and resistance levels until much later. These levels represent an exchange of contracts between buyers and sellers that may or may not be disproportionate. Asking questions like “Who is getting hurt/who’s screaming uncle?” and “Who is benefiting/who is winning out?” helped me create more effective battle plans and trading theories.
At these levels, there are humans with emotions involved. Some are benefiting from others’ pain, while others are getting squeezed out. Knowing who the players are at certain areas within a chart, such as whales, bots, banks, or commoners, is key. These levels will be your stop, your entry, and your goal(s), and your trading plans and thesis will revolve around them.
If you’re a newer trader, it’s crucial to take a step back and conceptualize things. Take the time to ask questions and don’t rush into the mad scramble of trying to make profits. If you’re using ThinkorSwim or Tradingview, both of which are fantastic for technical charting, experiment with the “volume profile” indicator. Try asking yourself one of the many questions above and see if you can do some sleuthing to better understand. Your trading will improve, and your trading plans will become higher quality.
Once I stopped racing to find the holy grail of indicators and started thinking things through, it was a big turning point for me. I became more consistent almost instantly. From the start, I knew I had to identify those magical support and resistance levels. But they seemed to vary in strength, and it wasn’t until I envisioned who was on the other side of the trades that things clicked. The “volume profile” helped with that.
I could see that where I once called a support was not actually an ideal support in the bigger picture. As a beginning day trader, I would get blown out repeatedly. The big guys – whales, banks, dark pool money, bots, and generally people with millions of dollars to spend – are where you want to look. Play off those massive volume levels and base your trading plans around those big guys and big volume areas.
In the words of Seinfeld, “Levels, Jerry, levels!” You can simplify today with this tactic by ditching half of your indicators. Whether you’re investing long-term, swing trading, or a scalping day trader, the levels where a lot of volume/orders are living are where you want to play off of. Those are your real support and resistance levels. They are your stops if it goes beyond where those whales are residing. To get the best risk to reward, do your best to enter as close to the stop area as possible. Then look to your next big resistance/support area – that’s your goal.
“Levels Jerry, levels!”.

