The Apgar test was introduced in the 1950s by midwives and doctors to assess the health of newborn babies quickly and simply. Based on a few basic questions, each rated with a score from 0-2 (0 being poor and 2 being excellent), it was designed to be fast and straightforward. I came across the idea of applying this concept to trading in Dr. Elder’s book “The New Trading for a Living”. A simple, quick rating system that can be used to evaluate different trading elements and achieve a more objective result has been incredibly useful.
After experimenting with Apgars in my overall trading system for the past few years, there are two that I use regularly. I have customized and modified them extensively, so they hardly resemble their original form. I highly recommend that traders read through this and check out Elder’s book to see how they can apply or adapt this concept to their trading. I have found that doing a quick Mental Apgar and Overall Market Grading Apgar work best for me.
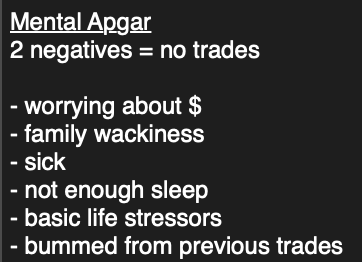
Mental Apgar

With this one, I actually reversed the grading by accident, but you still get the picture. I have listed the six or so main reasons or causes of stress or distraction in my life. If I’m being honest and find that it’s bothering me in that moment, I give it a point. Two or more points, and I do not trade until I’m able to figure it out or relax. I have this printed off, and it has sat right in front of my computer for years now, and I still use it every morning before trading.
Who knows how much stress and heartache this technique has saved me. I almost don’t need to do the Apgar anymore, as I know even before taking it now whether I’m mentally fit for trading or not. In the past, I’ve ignored it at my peril and traded even though I knew I wasn’t mentally fit. As traders, we never want the market to have an advantage over us. This Apgar helps to retain the edge that we have. If you are honest and answer the questions sincerely, then this could be a lifesaver for you.
Overall Market Grading Apgar
I debated whether or not to include this, but ultimately decided to share it with the world. At first, my instinct was to keep it proprietary and secret until I was ready to reveal it. However, I realized that this site and endeavor are all about giving. I need to work on being more selfless, charitable, and compassionate towards others. Disclosing this process of my system goes against my secretive and selfish nature, but it’s not like I invented it myself. I pulled from some pretty obvious sources, so here it is!
Remember to customize this to your liking and keep in mind that it’s just what I have set up for my particular plays and trading style. Tinker with it and adjust it however you like. It took me years of tinkering, and I still find myself adding or subtracting from it every now and then. So, this can be a long, continuing project for any trader. Of all the systemized trading stuff that I’ve applied, this is the most useful and helpful for me. I actually look forward to going through this every morning. It gives me an extra bit of confidence behind my decisions after seeing the results from this quick test.
Here’s how it works: First, gather your sectors or indicators that you would like to use for measuring (SPY, QQQ, ISM, individual stocks, etc.). Then, assign them priority values of either 1 or 2 points. Referring to the image, you can see that I have some of them as leaders (higher value) and laggers (lower value). I grade them based on how they look on the 4-hour chart using a momentum indicator (TTM_Squeeze or MACD) and basic high volume areas as sources of support or resistance. Sometimes, I also lay out Fibonacci retracements on the larger picture chart (for me, it’s a week chart).

It’s pretty straightforward and self-explanatory, I think. Higher numbers indicate momentum in that direction, so you can tell whether to lean bullish or bearish. It’s important to note that I try not to let bias or preference factor into the grading process at all, as this can render the whole thing untrustworthy.
The only other part to this is the section in the upper right that reads “Long-Term SPY Day/WK”. This lets me know the overall bullish or bearish status of the market. I usually evaluate this on a weekly or monthly chart, as it is a big-picture view that changes slowly. You can see that I have rules based around this for my position size and risk as well.
For example, if the long-term chart is bullish (green), I can go full position on longs. But if a short play presents itself during this bullish rating, it’s a half position for shorting. And vice versa. If it’s yellow, then the overall market is volatile, and it’s a half position for both longs and shorts until it decides on a direction.
All of this came from Dr. Elder’s implementation of the Apgar test to certain aspects of his trading. I just applied it to a quick mental self-test and a bigger grading system. Maybe this idea could spark an interest in what aspects of your trading system and routine it could help you with.

